Within the design process, what methods are needed to identify relevant information from the abundance of data sets available? How can the data be visualized in order to derive subsequent meaningful decisions for the design? We explore these questions experimentally in the MAS LA Module: Programming Landscapes.
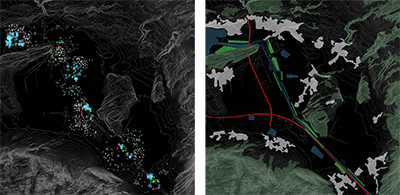
While classic statistical representations have the main task of communicating complex ideas clearly, exactly and efficiently, we are currently living in a time that has almost unrestricted opportunities to access data that can be considered design-relevant. Through simple technical access using, e.g. quadrocopters (drones: remote controlled aircraft) in combination with sensors, various data that deliver real-time information on site-specific conditions can be recorded.
Data that provides supplements to the classic GIS information ‘datascapes’, especially in landscape architecture, can be applied as design tools on various levels. Experience with our students, however, show that the data sets are often not completely understood and the resulting false parameters can then influence the design. The designs quickly become endlessly complex and can no longer be controlled.
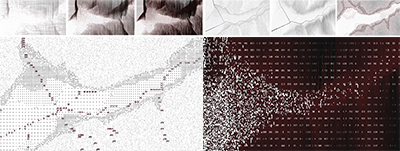
For the last three years, the MAS LA program has been involved in researching new fields of application that explore the range of the programs in relation to the representation of real data (sensor data) as a design tool. Our experience up to now is based on the use of Processing, an Open Source programming language with direct visual output. The main goal of the course is to learn a creative approach to handling complex correlations. At the beginning, the elementary understanding of the data is the focus, which will subsequently be researched for new strategies. These are then visualized in order to be able to make a design-relevant decision.
An observation of the software packages generally applied for data visualization reveals that the process of reflection is often forgotten. The visual representation, whether it is a model or a drawing, is often a very similar fact or design solution and runs the danger of being mistaken for the other. Our experience shows that in ‘Big Data Visualizations’ in landscape architecture, in addition to understanding the data, a certain basic understanding of programming is required in order to be able to independently control the situation and the application of the data. The current rapid developments in technology make an almost unlimited application of optional complex data sets possible; whether self-developed or downloaded from an open-source site. In turn, this requires a methodical and didactic further development of the design tools on university sites.